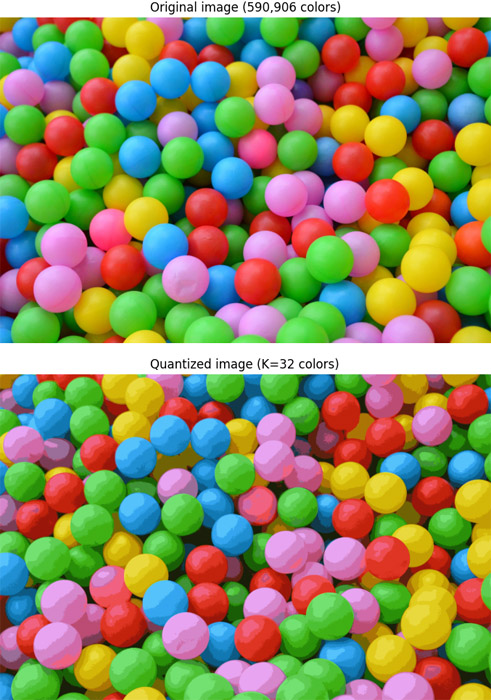
Color quantization is the process that is used to reduce the number of colors in an image while preserving the visual appearance of the image. The objective is to reproduce an image which is visually similar to the original image. It's commonly used for image compression or when the system has memory limitations. Several methods exist that can be used for color quantization.
K-means clustering is an unsupervised learning algorithm that automatically clusters data points based on the similarity between them. This algorithm can be used for color quantization in an image. Each pixel value of the image are clustered, and each cluster represents a unique color in the new image. When K-means clustering is used for color quantization, then K value represents the number of unique colors in the new image. For example, if K=32 then an image will have 32 unique colors.
This tutorial provides example how to use K-means clustering for color quantization. To achieve this objective, we will use scikit-learn machine learning library.
Using pip package manager, install scikit-learn and scikit-image from the command line.
pip install scikit-learnpip install scikit-imageWe read and preprocess the image. We transform an image to a 2D numpy array by using np.reshape method.
An image contains pixels which values are between 0 and 255. Large integer values can slow down the training process. So we normalize the image data by dividing each pixel value by 255 to get a range of 0 to 1.
The KMeans.fit method is used to train a K-means clustering model. We use a sample of the data from the original image for training process.
- The
labelslist contains the index of the cluster each pixel belongs to. - The
centerslist contains cluster centers which represents the color palette.
import numpy as np
import matplotlib.pyplot as plt
from skimage import io
from sklearn.cluster import KMeans
from sklearn.utils import shuffle

colors = 32
imgOriginal = io.imread('test.jpg')

imgArray = np.reshape(imgOriginal, (-1, 3))
imgArray = imgArray / 255

imgArrayTrain = shuffle(imgArray, random_state=0)[:10000]
kmeans = KMeans(n_clusters=colors, random_state=0).fit(imgArrayTrain)

labels = kmeans.predict(imgArray)
centers = kmeans.cluster_centers_
img = np.reshape(centers[labels], imgOriginal.shape)

fig, (ax1, ax2) = plt.subplots(1, 2)
ax1.axis('off')
ax1.set_title('Original image (590,906 colors)')
ax1.imshow(imgOriginal)
ax2.axis('off')
ax2.set_title('Quantized image (K=32 colors)')
ax2.imshow(img)
plt.show()
The number of unique colors was reduced from 590,906 to only 32.


Leave a Comment
Cancel reply