TensorBoard is a tool which allows visualizing training metrics (e.g. loss and accuracy), model graph, activation histograms, profiling results, etc.
This tutorial demonstrates how to visualize training metrics using TensorBoard. TensorFlow 2 depends on TensorBoard. So we only need to install tensorflow using pip package manager from the command line.
pip install tensorflowWe created a model that is used to classify images. It consists of a sequence of one Flatten layer and two Dense layers. We passed metrics argument to the compile method in order to report the accuracy of the training. We created an instance of the TensorBoard class. A constructor has the log_dir parameter which defines the path of the directory where to save the log files. An instance of TensorBoard are passed to the fit method as callbacks argument. We use 15 epochs to train the model.
from tensorflow import keras

fashionMnist = keras.datasets.fashion_mnist
(trainImages, trainLabels), (testImages, testLabels) = fashionMnist.load_data()

trainImages = trainImages / 255
testImages = testImages / 255

model = keras.Sequential([
    keras.layers.Flatten(input_shape=(28, 28)),
    keras.layers.Dense(128, activation='relu'),
    keras.layers.Dense(10, activation='softmax')
])

model.compile(
    optimizer='adam',
    loss='sparse_categorical_crossentropy',
    metrics=['accuracy']
)

tensorBoard = keras.callbacks.TensorBoard(log_dir='logs')

model.fit(
    trainImages,
    trainLabels,
    epochs=15,
    validation_data=(testImages, testLabels),
    callbacks=[tensorBoard]
)
After we trained the model, we can start TensorBoard from the command line. We can provide the log directory with logdir option.
tensorboard --logdir logsThe command will inform that TensorBoard has started. By default, it is served at http://localhost:6006.
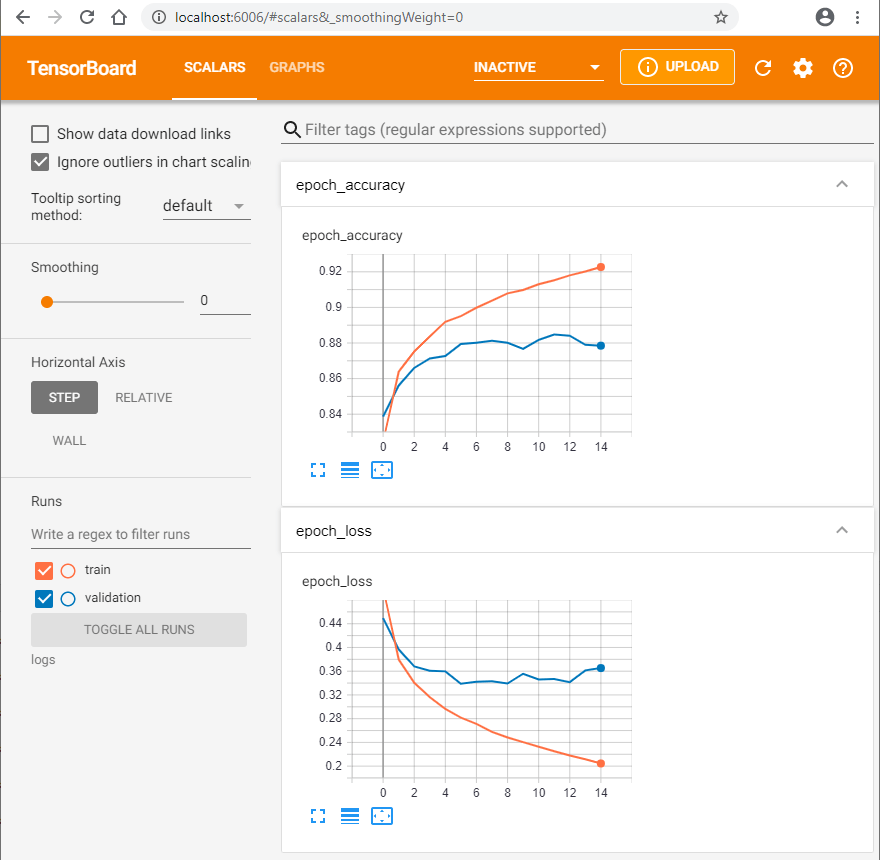
Once you open a browser, you can see the TensorBoard dashboard. It has tabs in the top navigation bar. If "Scalars" tab is selected, we can see the training metrics. In our case, dashboard displays a loss and accuracy for each epoch. The orange curves show the metrics for the training set and the blue curves shows the metrics for the validation set.


Leave a Comment
Cancel reply