
Grafana has built-in support for Loki for querying and displaying the logs. In this tutorial we will explain how to configure Loki as data source for Grafana.
Before beginning, make sure you have installed Grafana, Loki and Promtail in your system.
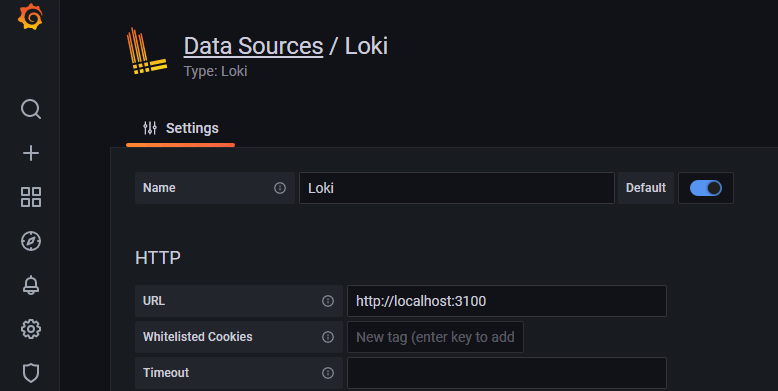
Open a web browser and log in to the Grafana dashboard. In the side menu click on "Configuration" (cog icon) and choose "Data sources". Click "Add data source" button. Scroll down to the "Logging & document databases" section and select "Loki". Enter the name of data source and URL of Loki server. Press "Save & test".
To view the logs, click on "Explore" in the side menu. In the top-left dropdown choose the Loki datasource (1). Click "Log browser" button (2) and select a log file (e.g. /var/log/syslog).
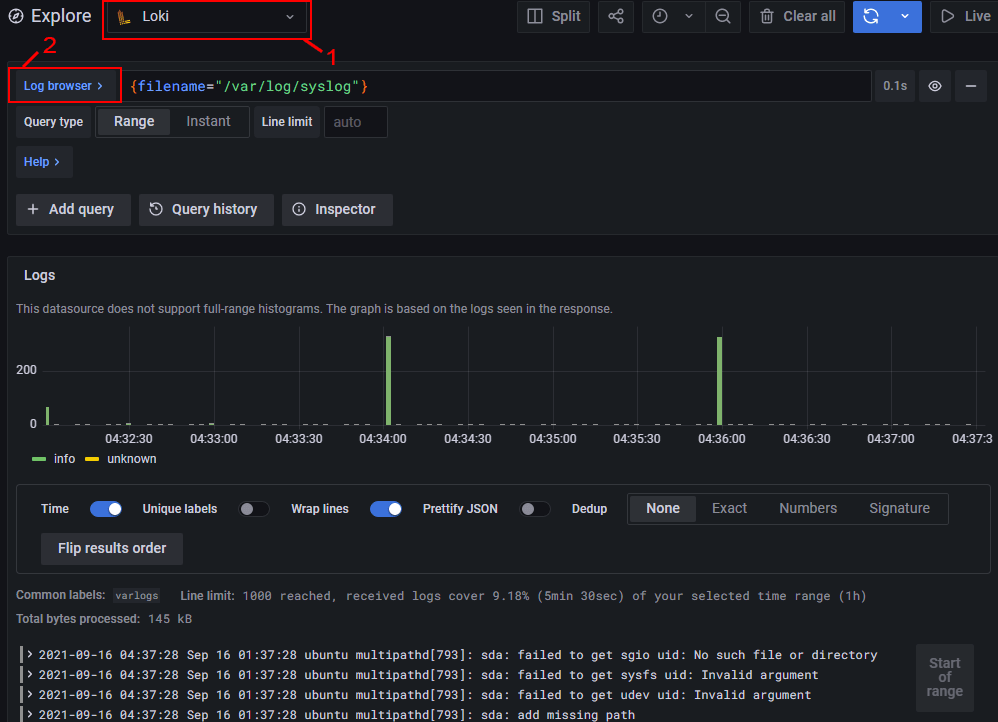
At the bottom of the page you will see log file entries.

Leave a Comment
Cancel reply