Grafana supports a variety of data sources such as MySQL, PostgreSQL, Prometheus, InfluxDB, and others. In this tutorial we will demonstrate how to configure MariaDB as data source for Grafana.
Before starting make sure you have installed MariaDB and Grafana on the server.
mariadb --version
grafana-server -v
First of all we need to setup a database table and populate it with data. Connect to the MariaDB Server via command line:
mariadb -u root -pCreate a database and a new user that will be used by Grafana for connection to the database. Grant required permissions to the user.
CREATE DATABASE grafanadb;

CREATE USER grafana@localhost IDENTIFIED BY 'pwd123';
GRANT SELECT ON grafanadb.* TO grafana@localhost;
Create a table and insert few rows for testing.
USE grafanadb;

CREATE TABLE cpu_metrics (
  id BIGINT UNSIGNED NOT NULL PRIMARY KEY AUTO_INCREMENT,
  cpu_usage DECIMAL(5, 2) UNSIGNED NOT NULL,
  created_at DATETIME NOT NULL
);

INSERT INTO cpu_metrics (cpu_usage, created_at) VALUES
    (10.55, '2021-03-27 08:00:00'),
    (15.10, '2021-03-27 08:01:00'),
    (12.62, '2021-03-27 08:02:00'),
    (17.80, '2021-03-27 08:03:00'),
    (21.00, '2021-03-27 08:04:00');
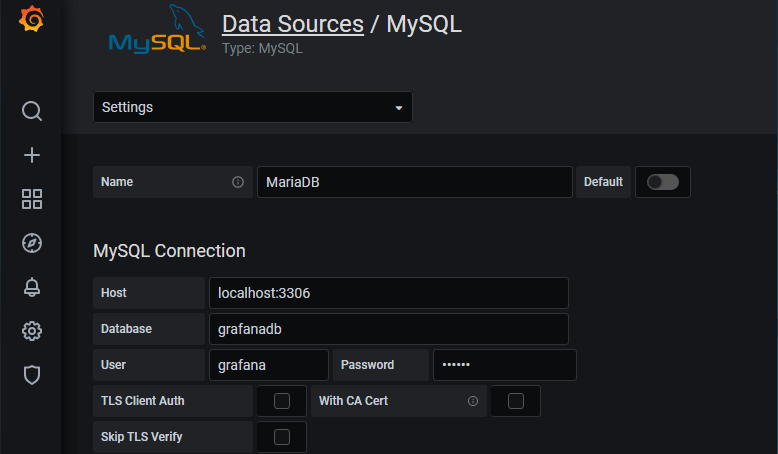
Now open a web browser and log in to the Grafana. Click on "Configuration" in the side menu and choose "Data Sources". Press "Add data source" button. Scroll down to the "SQL" section and select "MySQL". Data source for MySQL database is compatible with MariaDB. Provide the name of data source and MariaDB connection information: host, database, user, and password. Click "Save & Test".

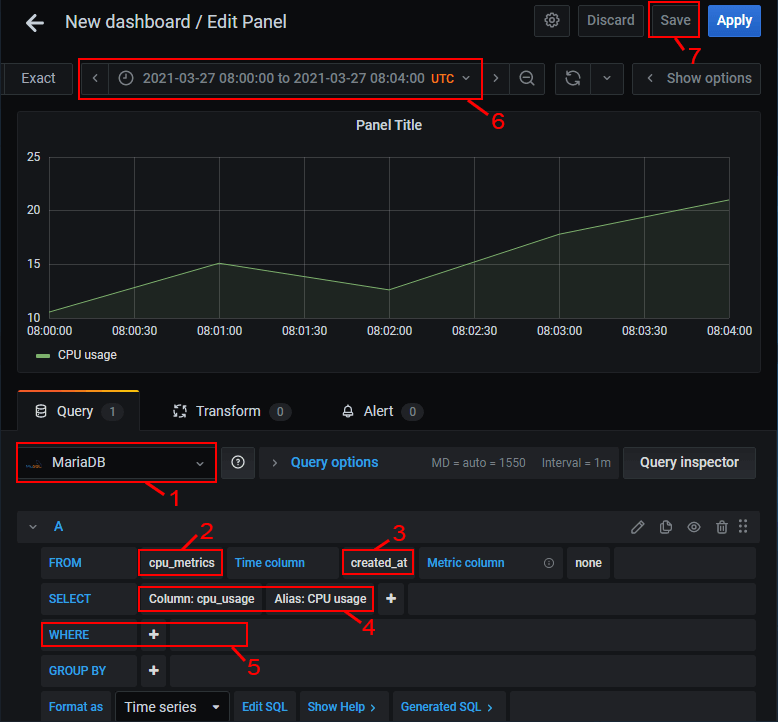
Now click + icon in the side menu and choose "Dashboard". Click "Add an empty panel". Choose MariaDB from the data source selector (1). Select table (2), time column (3), data column and it alias (4). Remove selection from WHERE clause (5). Choose time range and time zone (6). Click "Save" button (7). Provide the dashboard name, and then click "Save".

We have created a dashboard and added the panel which displays data from MariaDB database.


The 1 Comment Found
Also allow remote connections on MySQL Change or Add the bind address value to the end of the file. Restart MySQL Restart the MySQL and check the status. I then go back into Grafana, finish and save the MySQL data source for Zabbix.
Leave a Comment
Cancel reply