
Grafana is a cross-platform data visualization and analytics tool that can used for monitoring purposes. It fetches data from various data sources such as MySQL, Prometheus and visualizes data in the form of graphs, charts, etc. Grafana is accessible to the user from a web browser. Grafana is an open-source project that available under the Apache License 2.0.
This tutorial explains how to install Grafana on Raspberry Pi.
Connect to Raspberry Pi via SSH. Download GPG key and add it to the trusted keys list. Then add the Grafana repository and update the package lists.
curl -sS https://packages.grafana.com/gpg.key | sudo apt-key add -
echo "deb https://packages.grafana.com/oss/deb stable main" | sudo tee /etc/apt/sources.list.d/grafana.list
sudo apt update
Execute the following command to install Grafana:
sudo apt install -y grafanaAfter the installation is finished, we can check Grafana version:
grafana-server -vBy default, Grafana service is not running. We can start the service with command:
sudo service grafana-server startTo check whether Grafana service is running, use the following command:
sudo service grafana-server statusWe can also stop or restart the Grafana service:
sudo service grafana-server stop
sudo service grafana-server restart
In order to start up Grafana service on boot, we need to enable it:
sudo systemctl enable grafana-serverTo access Grafana we need to get the IP address of the Raspberry Pi:
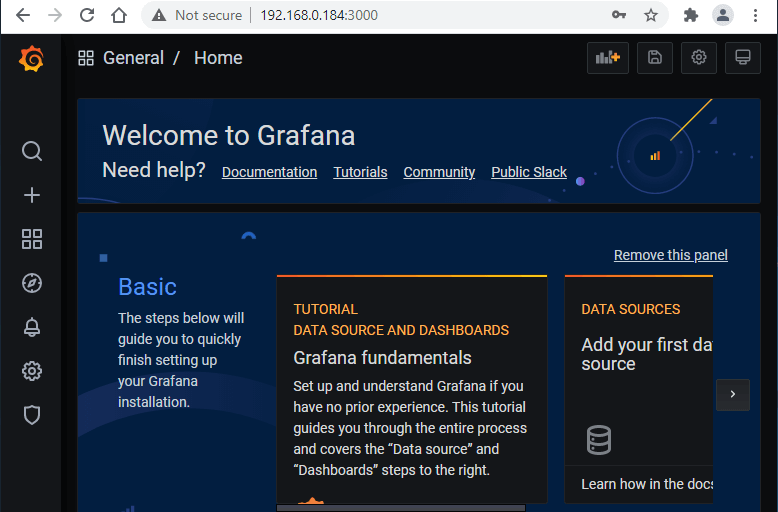
hostname -IOpen a browser and go to address http://<IP_ADDRESS>:3000, where <IP_ADDRESS> is IP address of Raspberry Pi. Log in to the Grafana with the default username (admin) and password (admin).
If you want to completely remove Grafana and related dependencies, execute the following command:
sudo apt purge --autoremove -y grafanaNow remove systemd service:
sudo service grafana-server stop
sudo systemctl disable grafana-server
sudo systemctl daemon-reload
sudo systemctl reset-failed
You can also remove the Grafana data, logs, configuration, and repository:
sudo rm -rf /var/lib/grafana
sudo rm -rf /var/log/grafana
sudo rm -rf /etc/grafana
sudo rm -rf /run/grafana
sudo rm -rf /etc/apt/sources.list.d/grafana.list


Leave a Comment
Cancel reply