
Binary classification is the process that is used to classify data points into one of two classes. For example, whether a customer will buy a product or not, emails are spam or not, whether a patient has certain disease or not.
Let’s say we have a set of labeled points:
| f1 | 3.2 | 6.3 | 6.2 | 3.3 | 3.1 | 5.6 | 3.9 | 5.5 |
| f2 | 5.5 | 5.9 | 5.7 | 5.6 | 5.4 | 5.8 | 5.5 | 5.7 |
| label | 1 | 0 | 0 | 1 | 1 | 0 | 1 | 0 |
We have two features for each point, represented by the f1 and f2. In addition, we have one of two class labels for each point. Label 0 represents the first class, and label 1 represents the second class.
And we have some unlabeled points:
| f1 | 4.3 | 5.3 | 5.0 | 4.2 |
| f2 | 5.4 | 5.9 | 5.8 | 5.6 |
A trained model should predict whether a new point should be labeled 0 or 1.
This tutorial shows an example how to create and train a model which classifies data points into one of two classes. We will use TensorFlow 2.
Using pip package manager, install tensorflow from the command line.
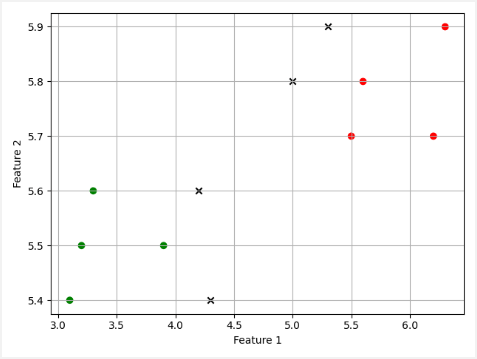
pip install tensorflowIn order to better understand the data, we will display a scatter plot where each value in the data is represented by a dot. We declare arrays of features (trainF1, trainF2) and labels (trainLabels) for training a model. Unlabeled points for testing are declared as testF1 and testF2.
plot.py
import numpy as np
import matplotlib.pyplot as plt

trainF1 = np.array([3.2, 6.3, 6.2, 3.3, 3.1, 5.6, 3.9, 5.5], dtype=float)
trainF2 = np.array([5.5, 5.9, 5.7, 5.6, 5.4, 5.8, 5.5, 5.7], dtype=float)
trainLabels = np.array([1, 0, 0, 1, 1, 0, 1, 0], dtype=float)

testF1 = np.array([4.3, 5.3, 5.0, 4.2], dtype=float)
testF2 = np.array([5.4, 5.9, 5.8, 5.6], dtype=float)

colors = ['red', 'green']
colorsList = [colors[int(label)] for label in trainLabels]

plt.scatter(trainF1, trainF2, c=colorsList)
plt.scatter(testF1, testF2, c='black', marker='x')
plt.xlabel('Feature 1')
plt.ylabel('Feature 2')
plt.grid()
plt.show()
Label 0 is represented by red dots and label 1 is represented by green dots. Unlabeled points are represented by black crosses.
We build a model with three Dense layers. We have two features, so model has two inputs. Model has one output.
Inputs for the model should be presented in the single array. So trainF1 and trainF2 arrays are joined along a new axis by using the stack method.
The model is compiled using binary cross-entropy loss function and Adam optimizer. We use 300 epochs to train the model. After training, the model is saved in HDF5 format.
train.py
from tensorflow import keras
import numpy as np

trainF1 = np.array([3.2, 6.3, 6.2, 3.3, 3.1, 5.6, 3.9, 5.5], dtype=float)
trainF2 = np.array([5.5, 5.9, 5.7, 5.6, 5.4, 5.8, 5.5, 5.7], dtype=float)
trainFeatures = np.stack((trainF1, trainF2), 1)
trainLabels = np.array([1, 0, 0, 1, 1, 0, 1, 0], dtype=float)

model = keras.Sequential([
    keras.layers.Dense(64, activation='relu', input_shape=(2,)),
    keras.layers.Dense(32, activation='relu'),
    keras.layers.Dense(1, activation='sigmoid')
])

model.compile(optimizer='adam', loss='binary_crossentropy')

model.fit(trainFeatures, trainLabels, epochs=300)

model.save('model.h5')
A model was trained, and now we can predict labels for the given data points.
The model has one output, which value is in the range from 0 to 1. If the value of the output is less than 0.5 are assigned to label 0 and value greater than or equal to 0.5 are assigned to label 1.
- If prediction < 0.5 then label = 0
- If prediction >= 0.5 then label = 1
test.py
from tensorflow import keras
import numpy as np
import matplotlib.pyplot as plt
trainF1 = np.array([3.2, 6.3, 6.2, 3.3, 3.1, 5.6, 3.9, 5.5], dtype=float)
trainF2 = np.array([5.5, 5.9, 5.7, 5.6, 5.4, 5.8, 5.5, 5.7], dtype=float)
trainLabels = np.array([1, 0, 0, 1, 1, 0, 1, 0], dtype=float)
testF1 = np.array([4.3, 5.3, 5.0, 4.2], dtype=float)
testF2 = np.array([5.4, 5.9, 5.8, 5.6], dtype=float)
testFeatures = np.stack((testF1, testF2), 1)
model = keras.models.load_model('model.h5')
predictedLabels = model.predict(testFeatures)
predictedLabels = [int(label >= 0.5) for label in predictedLabels]
colors = ['red', 'green']
colorsList = [colors[int(label)] for label in trainLabels]
colorsListPredicted = [colors[label] for label in predictedLabels]
plt.scatter(trainF1, trainF2, c=colorsList)
plt.scatter(testF1, testF2, c=colorsListPredicted, marker='x')
plt.xlabel('Feature 1')
plt.ylabel('Feature 2')
plt.grid()
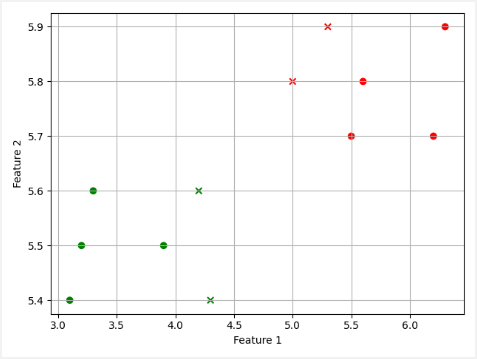
plt.show()A scatter plot shows that labels for data points were predicted correctly.


Leave a Comment
Cancel reply