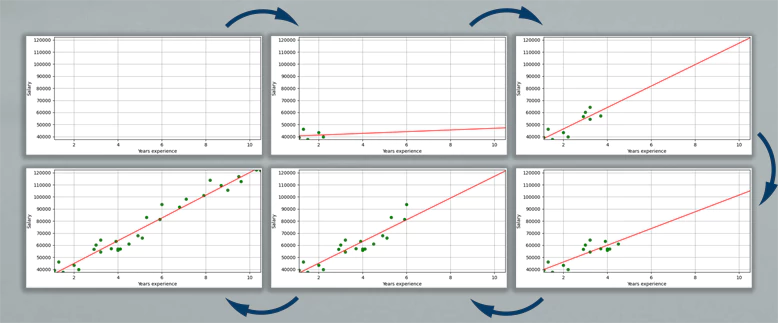
Simple linear regression is a statistical method that is used to analyze the relationship between two continuous variables. During a line fitting process using linear regression, it can be useful to see how the line fits the data when more data are added. This tutorial provides code example how to create line fitting animation of simple linear regression.
Prepare environment
- Install the following packages using
pip:
pip install scikit-learnpip install matplotlibpip install pandas- Download salary dataset from Kaggle and name it
salary.csv. The dataset contains salary based on the years of experience.
Code
The following steps are performed in the code:
- Using the
Pandaslibrary, we read a CSV file and load data into aDataFrame. - We select two columns from
DataFrameand assign values to variablesxandyrespectively, which will be used for the training process. - We set the x-axis and y-axis view limits, labels and enable the grid lines.
- We initialize the
LinearRegressionmodel provided by thescikit-learnlibrary. - The
Matplotliblibrary provides theFuncAnimationfunction, which repeatedly calls theanimatefunction. The delay between frames is configured withintervalparameter. In our case, 200 milliseconds. - On each call of
animatefunction, more data is added to the training set. - We fit a linear regression model to training data and make predictions.
- We draw a scatter and line plots to visualize training set and predicted values.
import matplotlib.pyplot as plt
import numpy as np
import pandas as pd
from matplotlib.animation import FuncAnimation
from sklearn.linear_model import LinearRegression

df = pd.read_csv('salary.csv')
x = df['YearsExperience'].to_numpy()
y = df['Salary'].to_numpy()

x_train = []
y_train = []
x_test = np.arange(x.min(), x.max() + 1).reshape(-1, 1)

fig, ax = plt.subplots(figsize=(8, 4))
ax.set_xlim(x.min(), x.max())
ax.set_ylim(y.min(), y.max())
ax.set_xlabel('Years experience')
ax.set_ylabel('Salary')
ax.grid()

scatter, = ax.plot([], [], 'go')
line, = ax.plot([], [], 'r')

lr = LinearRegression()


def animate(n):
    x_train.append([x[n]])
    y_train.append([y[n]])

    lr.fit(x_train, y_train)
    y_test = lr.predict(x_test)

    scatter.set_data(x_train, y_train)
    line.set_data(x_test, y_test)


anim = FuncAnimation(fig, animate, frames=x.size, interval=200, repeat=False)
plt.show()
Result


Leave a Comment
Cancel reply