
Grafana is a cross-platform tool for data visualization, analytics, and monitoring. Data is retrieved from various data sources such as MySQL, Prometheus and then data is presented in the form of graphs, charts, etc. Grafana provides a dashboard which is accessible to the user from a web browser. Grafana is an open-source project that released under the Apache License 2.0.
This tutorial explains how to install Grafana inside a Docker container in the Linux. Commands have been tested on Ubuntu.
Prepare environment
Make sure you have installed Docker in your system. If you are using Ubuntu, installation instructions can be found in the post.
Install Grafana
- Host network
Run the following command to create a container for Grafana that uses host network:
docker run -d --name=grafana --restart=always --network=host \
grafana/grafana-oss- User-defined bridge network
User-defined bridge network can be used for listening on different port. By default, Grafana service is listening on port 3000. It can be changed with -p option.
docker network create app-netdocker run -d --name=grafana --restart=always --network=app-net \
-p 8080:3000 \
grafana/grafana-ossTesting Grafana
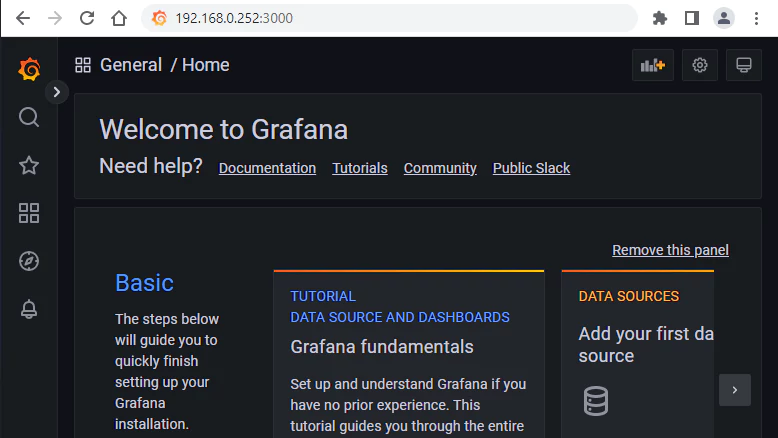
Open a web browser and go to http://<IP_ADDRESS>:3000, where <IP_ADDRESS> is the IP address of the system. Log in to the dashboard with the default username (admin) and password (admin).
Uninstall Grafana
To completely remove Grafana, remove its container:
docker rm --force grafanaRemove Grafana image:
docker rmi grafana/grafana-ossIf a user-defined bridge network was created, you can delete it as follows:
docker network rm app-net


Leave a Comment
Cancel reply